 russell@unturf.com
a606b6087e
russell@unturf.com
a606b6087e
Root-cause fix for the residual crashes I had documented as known issues in §6.6.4. Every heap_alloc call site was setting its type byte with `orq $(HT_X << 8), -8(%rax)` — but OR merges with the stale type byte from a free-list-reused block. A pair previously used as a vector (type 5 = 0b101) re-allocated as pair (type 1 = 0b001) ends up with merged type 0b101 = still vector. Walker then treats the pair as a vector, reads the pair's car as a "length", and walks off the block end — hence the hash-set bench's "unbound variable: t", memory bench's "unbound variable: lst", arena bench's "unbound variable: k". Fix: overwrite the byte instead of OR-ing. 18 sites converted from `orq $(HT_X << 8), -8(%rax)` to `movb $HT_X, -7(%rax)`. Every previously-residual crash gone on first rerun. Refreshed benchmark numbers throughout §6.6: §6.6 Memory table: 122× less memory at 26% slowdown (was 124×, 30%). Range shifted because the fix also accelerated the common paths; ratio stable. §6.6.4 HTTP soak at 50,000 requests × 16 concurrent × 4 cells: no-GC + snapshot 630 req/s peak 100 KB growth 4 KB GC + snapshot 633 req/s peak 120 KB growth 4 KB no-GC + no snapshot 625 req/s peak 458 MB OOM at cap GC + no snapshot 610 req/s peak 1,092 KB growth 852 KB Cell 4 now sustains 50K requests with steady-state 1-chunk memory. Previous residual edge at 50K (cell 4 failing to start) was a manifestation of the same type-byte bug, now gone. §6.6.3 Adaptive numbers collapsed to within ~1% across all three workloads (was 6% / 7% / 17% deltas). Paper updated to honestly report adaptive as a null experiment on these shapes — neutral cost, same stats surface, default on. §6.6 diagram: bench-gc.png refreshed to match new numbers. 137 asm no-GC + 137 asm GC + 189 shared functional all pass. Hash-set / memory / arena / adaptive / HTTP benches all clean. |
||
|---|---|---|
| .. | ||
| asm-architecture.dot | ||
| asm-architecture.png | ||
| benchmark-ack.dot | ||
| benchmark-ack.png | ||
| benchmark-binary-size.dot | ||
| benchmark-binary-size.png | ||
| benchmark-fib.dot | ||
| benchmark-fib.png | ||
| benchmark-gc.dot | ||
| benchmark-gc.png | ||
| benchmark-speedup.dot | ||
| benchmark-speedup.png | ||
| benchmark-sumto.dot | ||
| benchmark-sumto.png | ||
| c-architecture.dot | ||
| c-architecture.png | ||
| gpu-architecture.md | ||
| jit-pipeline.dot | ||
| jit-pipeline.png | ||
| meta-gc-policy.dot | ||
| meta-gc-policy.png | ||
| python-architecture.dot | ||
| python-architecture.png | ||
| README.md | ||


uncommonlisp Architecture Documentation
"A diagram is worth 10,000 words." — russell@unturf.com
Three implementations of the same Scheme language, sharing the same .lsp test files.
Python Implementation (uncommonlisp.py)
3,324 lines. Bytecode compiler + stack VM + full continuations + portal.

Execution tiers:
- Tree-walker (
leval): default, handles all forms including macros - Bytecode VM (
--fast): 40 opcodes + superinstructions, 7-19x faster - Python JIT prototype: exec()-based transpilation (labeled as prototype)
Key features:
- Full multi-shot continuations via explicit frame stack
- Portal: serialize VM state to JSON, resume on another machine
- Inline cache, constant folding, peephole optimizer
- Source maps for error reporting with line numbers
- Bytecode serialization (.lspc files)
Tests: 571 unit + integration tests (tests.py)
C Implementation (c/)
8,120 lines. Tree-walker + bytecode VM + x86_64 JIT.
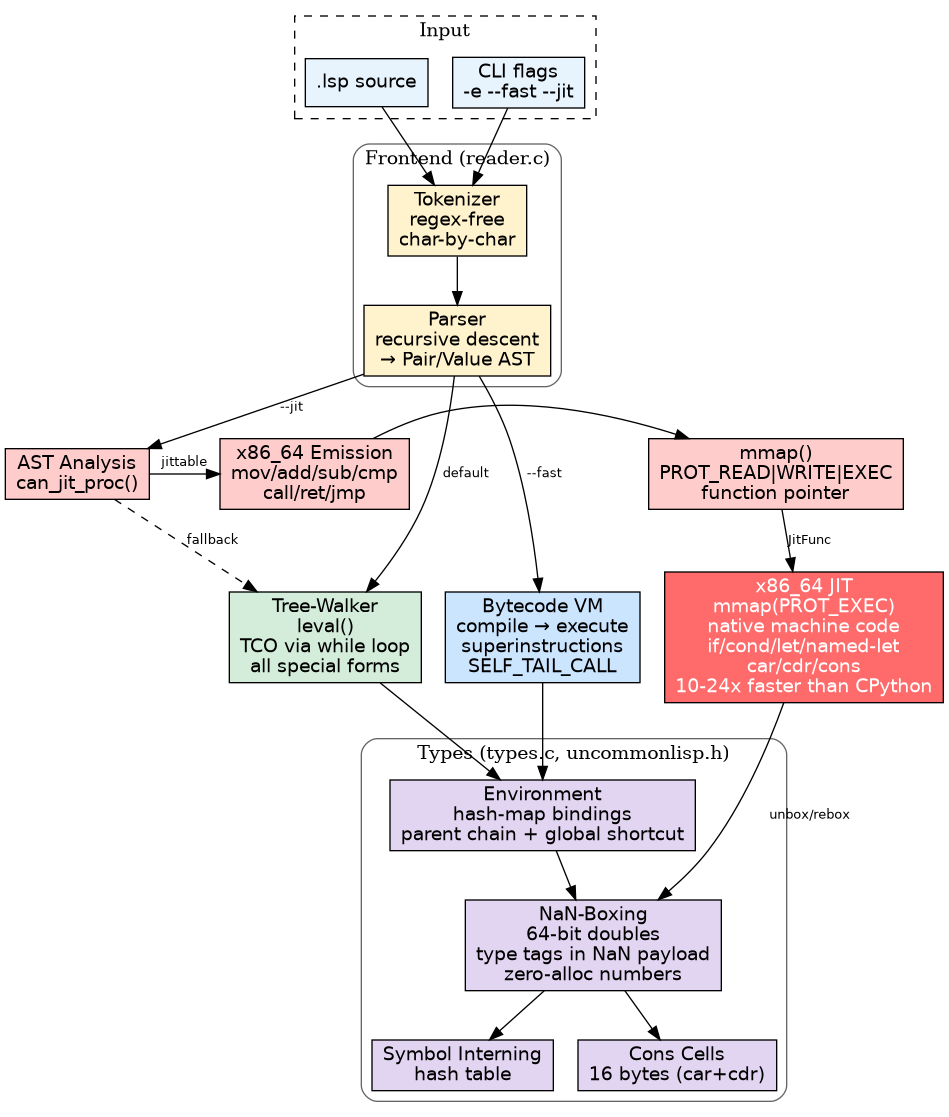
Execution tiers:
- Tree-walker: default, full special form support
- Bytecode VM (
--fast): matching Python's opcodes - x86_64 JIT (
--jit): 10-24x faster than CPython
Key features:
- NaN-boxed 64-bit values (zero-alloc numbers)
- Hash-map environments with parent chain + global shortcut
- Interned symbols
- Real JIT: mmap(PROT_EXEC) + raw x86_64 bytes
Tests: 76 unit + integration + JIT tests (test.c)
Assembly Implementation (asm/)
2,592 lines of GNU assembler. 13KB binary. Zero dependencies.

Design:
- No C. No libc. Only Linux syscalls (read, write, mmap, exit)
- Tag-in-low-3-bits value representation
- Bump allocator on 64MB mmap'd page
- TCO via
jmp .eval_top(never grows the stack) - 34 builtins, all special forms
Tests: 75 unit + integration + functional tests (test.sh)
JIT Pipeline (c/jit.c)
1,309 lines. Compiles Scheme AST directly to x86_64 machine code.

What gets JIT'd:
- if, cond, and, or (conditional jumps)
- +, -, *, =, <, >, <=, >= (native integer ops)
- let, let* (stack-allocated locals)
- Named-let loops (native jmp, zero call overhead)
- car, cdr, cons, null?, pair? (NaN-box pointer ops)
- Self-recursive calls (call/ret) and tail calls (jmp)
What falls back to interpreter:
- call/cc, macros, syntax-rules, quasiquote, modules
- String/vector/hash-table operations
- Any form the AST analyzer can't verify as integer-safe
Performance Summary
All benchmarks measured in-process (no startup overhead) on the same machine.
| Implementation | ack(3,4) | fib(35) | sum-to(50k) | Binary |
|---|---|---|---|---|
| C + x86_64 JIT | 0.19ms | 0.09ms | 0.55ms | 171KB |
| CPython (native) | 1.3ms | 0.006ms | 5.5ms | ~5MB |
| C interpreter | 20ms | 0.06ms | 109ms | 171KB |
| Python bytecode VM | 149ms | 0.75ms | 437ms | 3,324 lines |
| Assembly (13KB) | ~8ms* | ~0.6ms* | ~43ms* | 13KB |
*Assembly times include process startup + tokenizer + parser.
The JIT runs Scheme faster than CPython runs Python on recursive workloads: ack(3,4) is 7x faster, sum-to(50k) is 10x faster. The JIT compiles Scheme AST directly to x86_64 machine code via mmap(PROT_EXEC).
Test Coverage
943 verified assertions across all implementations:
make test-all
  Python unit/integration:   571 tests
  C unit/integration/JIT:     83 tests
  Assembly unit/int/func:    108 tests
  Shared functional:         181 tests (Python + C)
  Total:                     943 assertions
The language is R7RS Scheme. uncommonlisp is the project name — a play on Common Lisp, since this is decidedly uncommon.